
It’s the start of another great year in Alamo City.
In 2018, San Antonio home values are appreciating and the allures of owning Central Texas real estate keep getting better and better. Our food scene is booming and the culture in San Antonio is more vibrant than ever.
If you’re considering a move to San Antonio in 2018, there are several things you may want to consider as you look to buy or lease in the area. We put together a San Antonio real estate preparation blog to kick off all this year’s real estate decisions.
It’s impossible to predict exactly what the real estate market will do in 2018, but by using aggregated information--and our own internal data-- you can equip yourself for real estate success and stability.
Here’s what you should know about San Antonio real estate in 2018.
Home values continue to appreciate
The cost of San Antonio homes continues to grow in value, making them a consistently good investment for any would-be homebuyers. Though Zillow predicts that those numbers will appreciate less aggressively than we saw in 2017, they still forecast a 3.5% appreciation, compared to last year’s 7.3%.
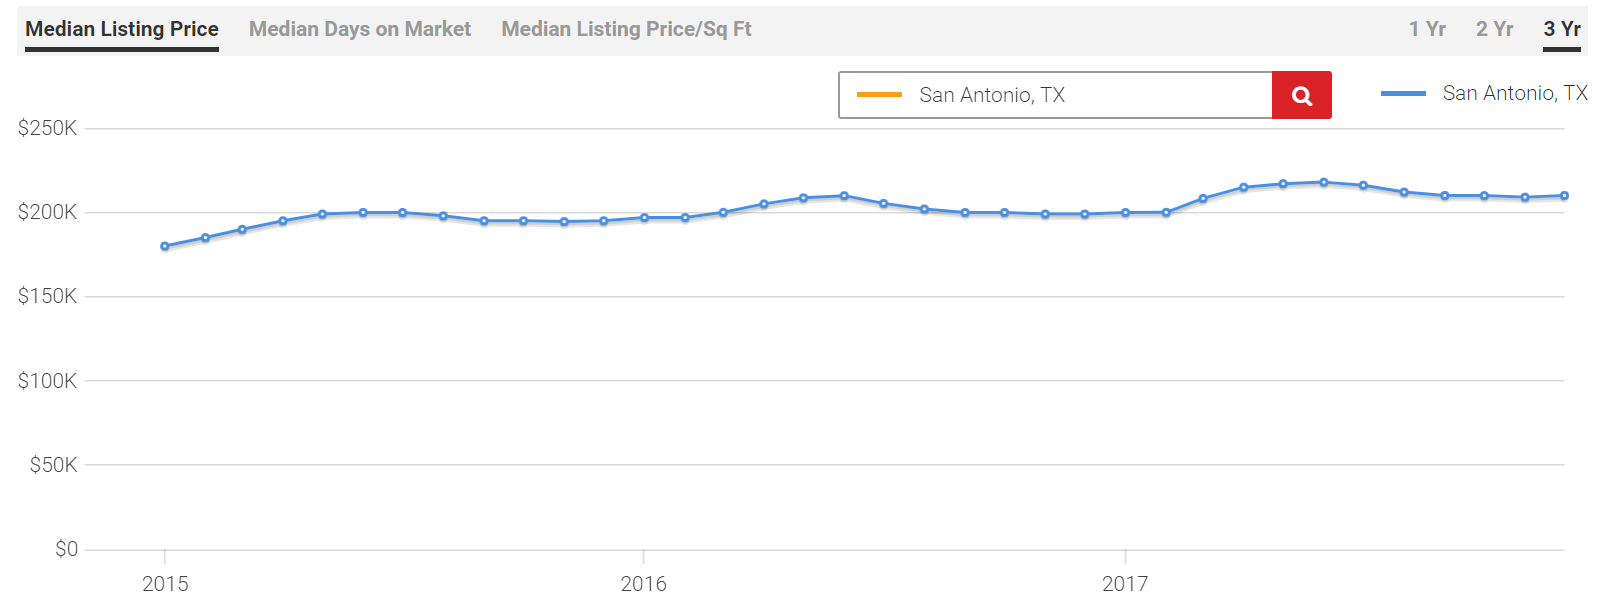
The median cost of purchasing a San Antonio home
Realtor.com says San Antonio’s median home value is $245,000 at the start of 2018.The chart below is also from Realtor.com; it shows the appreciation of San Antonio homes over the past three years.
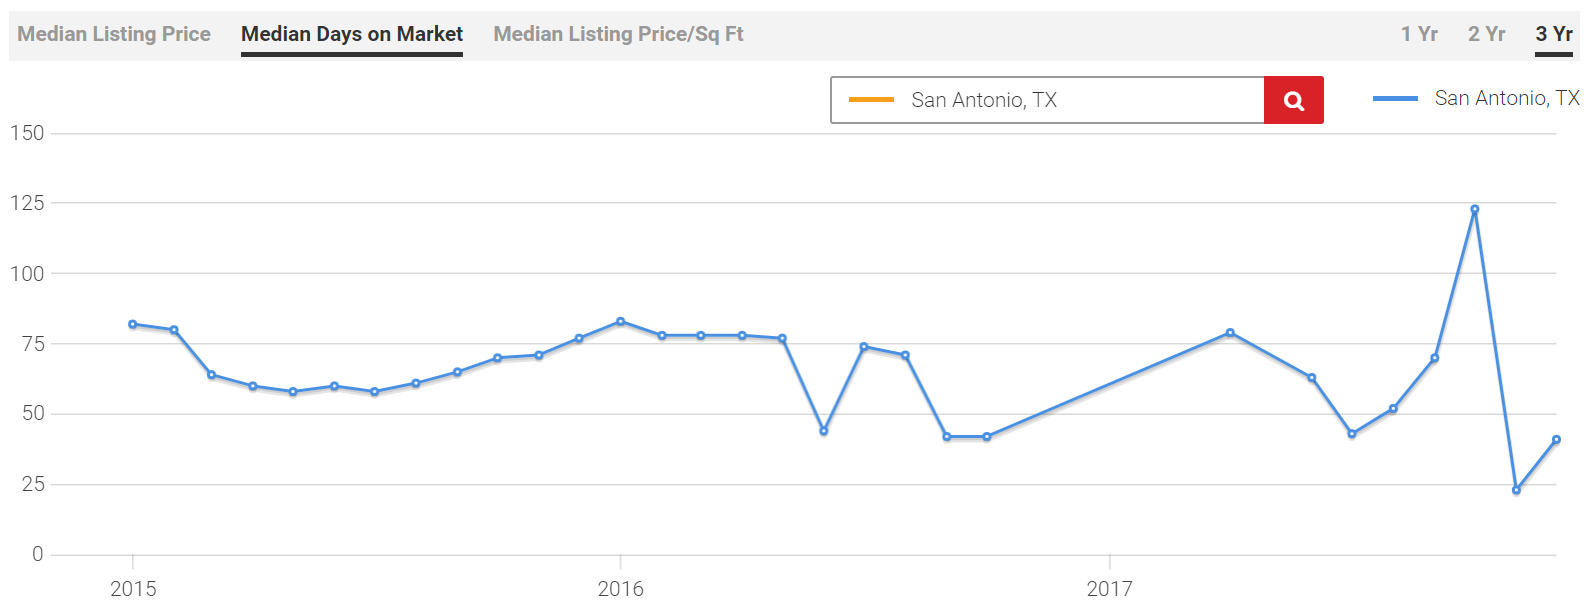
As homes have appreciated, their average days on market have fluctuated, but are currently down. This is great news for those selling today. It means less time between the day your home goes on the market and the day you sell it to the next San Antonio family.
San Antonio cost of living
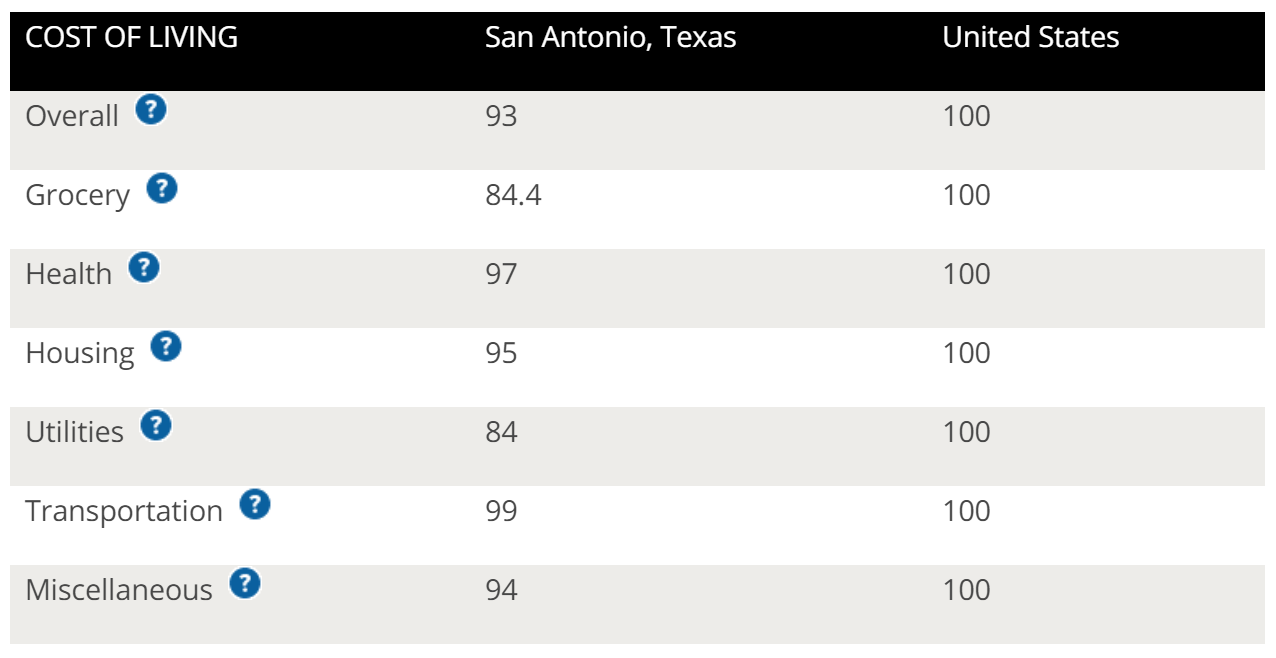
According to Bestplaces, San Antonio has a slightly lower cost of living than the U.S. average. There are several factors to make this assessment, including the cost of food, transportation, housing, and health, among other factors.
San Antonio is the 7th largest city in America. Compared to other large cities in America, San Antonio continues to be surprisingly affordable across the board. When you run the numbers, it is remarkable how far your dollar goes in Alamo City compared to both the US average and other similarly-sized metroplexes.
To understand the chart below, each “100” in the United States’ column represents the national average within that row/category. Since San Antonio’s numbers are below that number, San Antonio has lower costs across the board!
Median rental costs in San Antonio
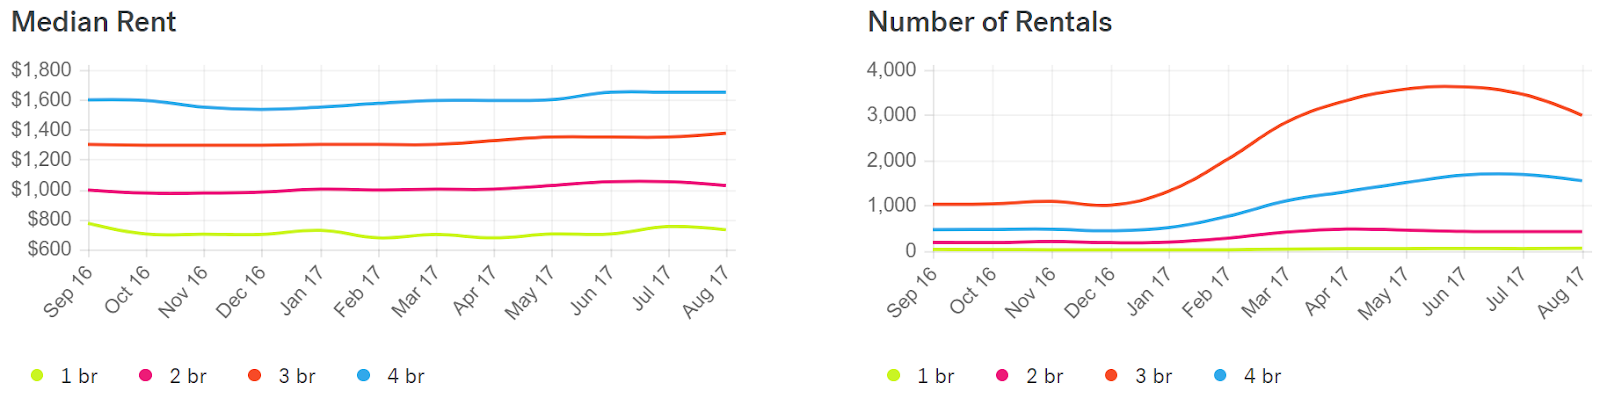
Below is a rental chart from Trulia that shows the average costs and number of rentals that occurred in the last year, ending in August. Each color line represents different rental sizes—use the color key below the charts to see which line is adjacent to which cost.
This sort of data can be used to make many decisions. For example, it appears there may be more competition for rentals from January through August. September through December seems to show a less competitive time to enter a lease agreement, increasing your chances of landing a good deal.
We hope this helps your new year real estate decision-making. If you are in the market to buy or sell a San Antonio home, reach out to JB Goodwin. One of our agents will be happy to help you navigate the San Antonio real estate market. Contact us today. We wish you a fantastic year in 2018!
Posted by Mary Ann Castro on
Leave A Comment